April 2026 Update
Automatic Emails
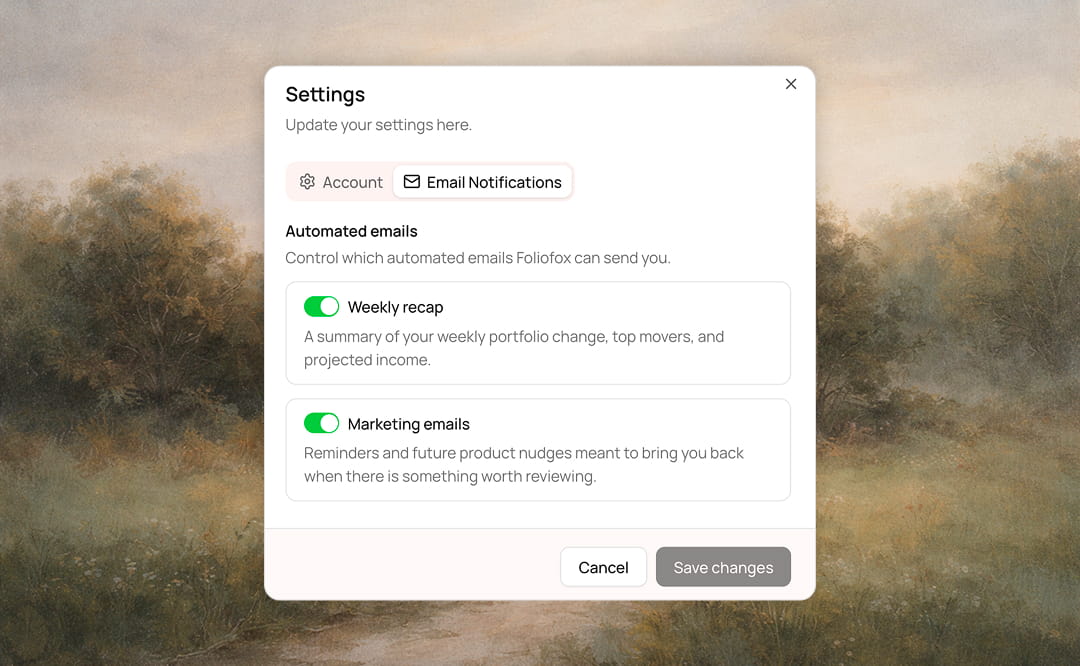
Portfolio updates, directly in your inbox.
We worked on a new infrastructure for automatic Foliofox emails.
- This means Foliofox can now send portfolio-related updates, starting with weekly recaps.
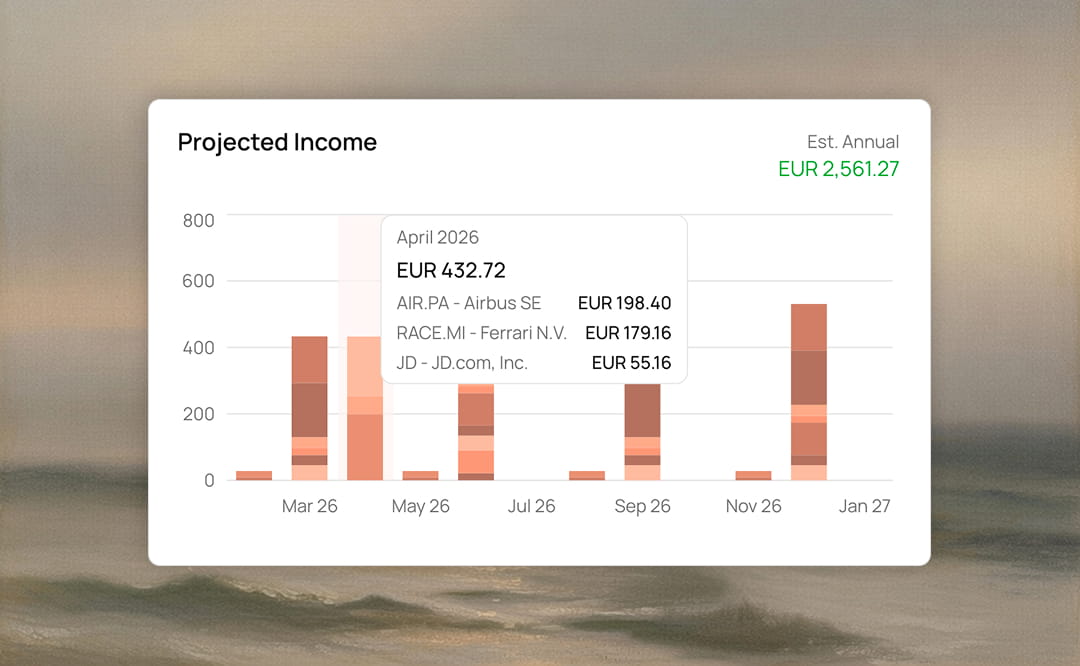
- Weekly recaps will help you stay updated on your portfolio change, top movers, and projected income.
The first automatic emails will start rolling out in May 2026. You can opt-out from the dashboard settings anytime.
Realized P/L on Asset Pages
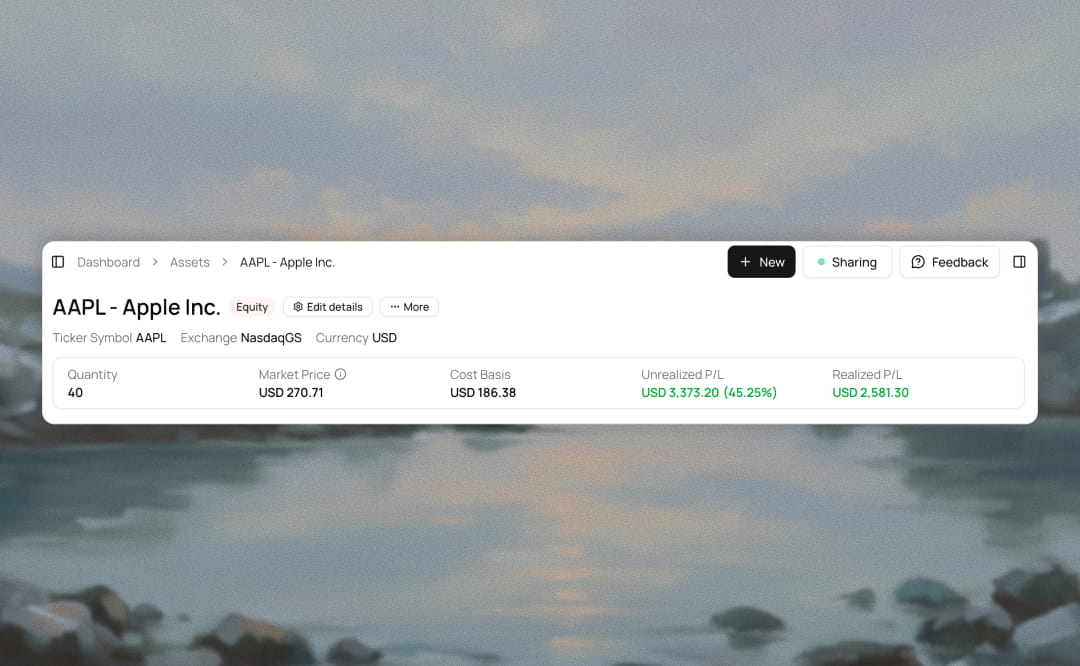
A clearer view of what you’ve actually gained or lost.
- Asset pages now show realized profit and loss.
- This gives you a better view of the gains or losses already locked in through completed SELL records.
Almost 100 Stars on GitHub
Foliofox is now getting close to 100 stars on GitHub.
If you like the project and want to support it, starring the repo would really help us reach this milestone.
It’s a small gesture, but it makes a real difference for an open-source project.